


How To Monitor Your Savings To Increase Spending In Retirement
Last week we discussed the basic rationale for developing a safe withdrawal rate. Historically, balanced portfolios have been able to sustain withdrawals of at least 4% of initial value, adjusted for inflation — “the 4% rule.” However, most of the time, higher rates are sustainable. But how can we know if a higher rate is sustainable? This week we look at what determines differences in withdrawal rates and suggest ways to monitor performance to balance the need for safety with the ability to spend more from the portfolio.
Returns and spending rates
Once we fix the planning horizon at 30 years, the big unknown that causes the withdrawal to change over time is portfolio returns. Typically, periods of higher returns are accompanied by higher spending rates, as can be seen in Figure 2. However, the connection isn’t perfect. For those that like correlations coefficients, the correlation is 62%. This means that some 30-year periods with low average returns can sustain relatively high withdrawal rates and some periods with high average returns that can only sustain low withdrawal rates.
Figure 1: Maximum Withdrawal and Annual Returns

Source: DESMO Wealth Advisor, LLC calculations. Historical data from Rober Shiller from 1871 to 1925, and Ibbotson data from Dimensional Fund Advisors since 1926.
For example, in the 30-year period started in 1890, the annual return on the 60/40 portfolio was as low as 2.9%, but the sustainable rate was 6.3% of initial value. In contrast, for the period started in 1970, the annual return was 5.8%, while the maximum withdrawal rate was only 4.6%. Why is that? It turns out that there is a better predictor for maximum withdrawal rates than average returns over the period.
The sequence of your returns matters
In Figure 3, we selected the four periods that start in 1953, 1965, 1968, and 1972. To highlight concepts, we focus on the growth of a hypothetical $1 (cumulative returns) invested in a 60/40 index over the periods without any withdrawal from the portfolios. None of the conclusions change if we introduce a constant withdrawal rule, like the 4%.
Start by comparing periods 1953 and 1965. Their cumulative returns are very similar, as can be seen from the fact that the initial $1 dollar investment ends up at roughly the same point in both cases. The annualized returns for the two periods are 3.8 for 1953 and 3.4 for 1965 (the date refers to the start of the 30 year period). However, the sustainable withdrawal rates are very different: 7.1% in the 1953 period vs 4.1% in the 1965 period. Why is that?
Figure 2: Growth of $1 over selected periods

Source: DESMO Wealth Advisor, LLC calculations. Historical data from Rober Shiller from 1871 to 1925, and Ibbotson data from Dimensional Fund Advisors since 1926.
The key difference occurs over the first ten years. While the dollar more than doubled (at $2.15) by the end of year 10 for the 1953 period, it was well below $1 for the 1965 period ($0.83). The sequence of returns matters more than the total return. A notable feature across the periods with low sustainable withdrawal rates is relatively poor returns during the first 10 years. The two periods starting in 1968 and 1972 confirm this. The periods starting in 1965, 1968, and 1972 have almost identical 10-year returns and very similar withdrawal rates (4.1%, 4.1%, and 4.6% of initial value). It is interesting to note that in 1972 and 1968, the cumulative returns (and therefore annual returns) over the entire 30-year period are higher than in the 1953 period. However, sustainable rates are much lower for these years. If high returns come after the 10-year mark, they may not do much to increase the sustainable withdrawal rate, and 1972 is a perfect example of that.
General patterns
The next figure shows the relationship between annual returns over the first 10 years and withdrawal rates. The tighter relationship can be seen in the chart. The correlation between the two variables is 87%! Knowing the annual return over the first 10 years is actually more useful than knowing the annual return over the entire 30 year period.
Figure 3: First 10 Years Returns and Withdrawal Rates

Source: DESMO Wealth Advisor, LLC calculations. Historical data from Rober Shiller from 1871 to 1925, and Ibbotson data from Dimensional Fund Advisors since 1926.
Obviously, when you retire you don’t know either one of them. But the chart is encouraging. What is the predictive power of 5-year returns? Although not as good as knowing 10-year returns, 5-year returns have a correlation of 72% with sustainable withdrawal rates. Again, better than average 30-year returns.
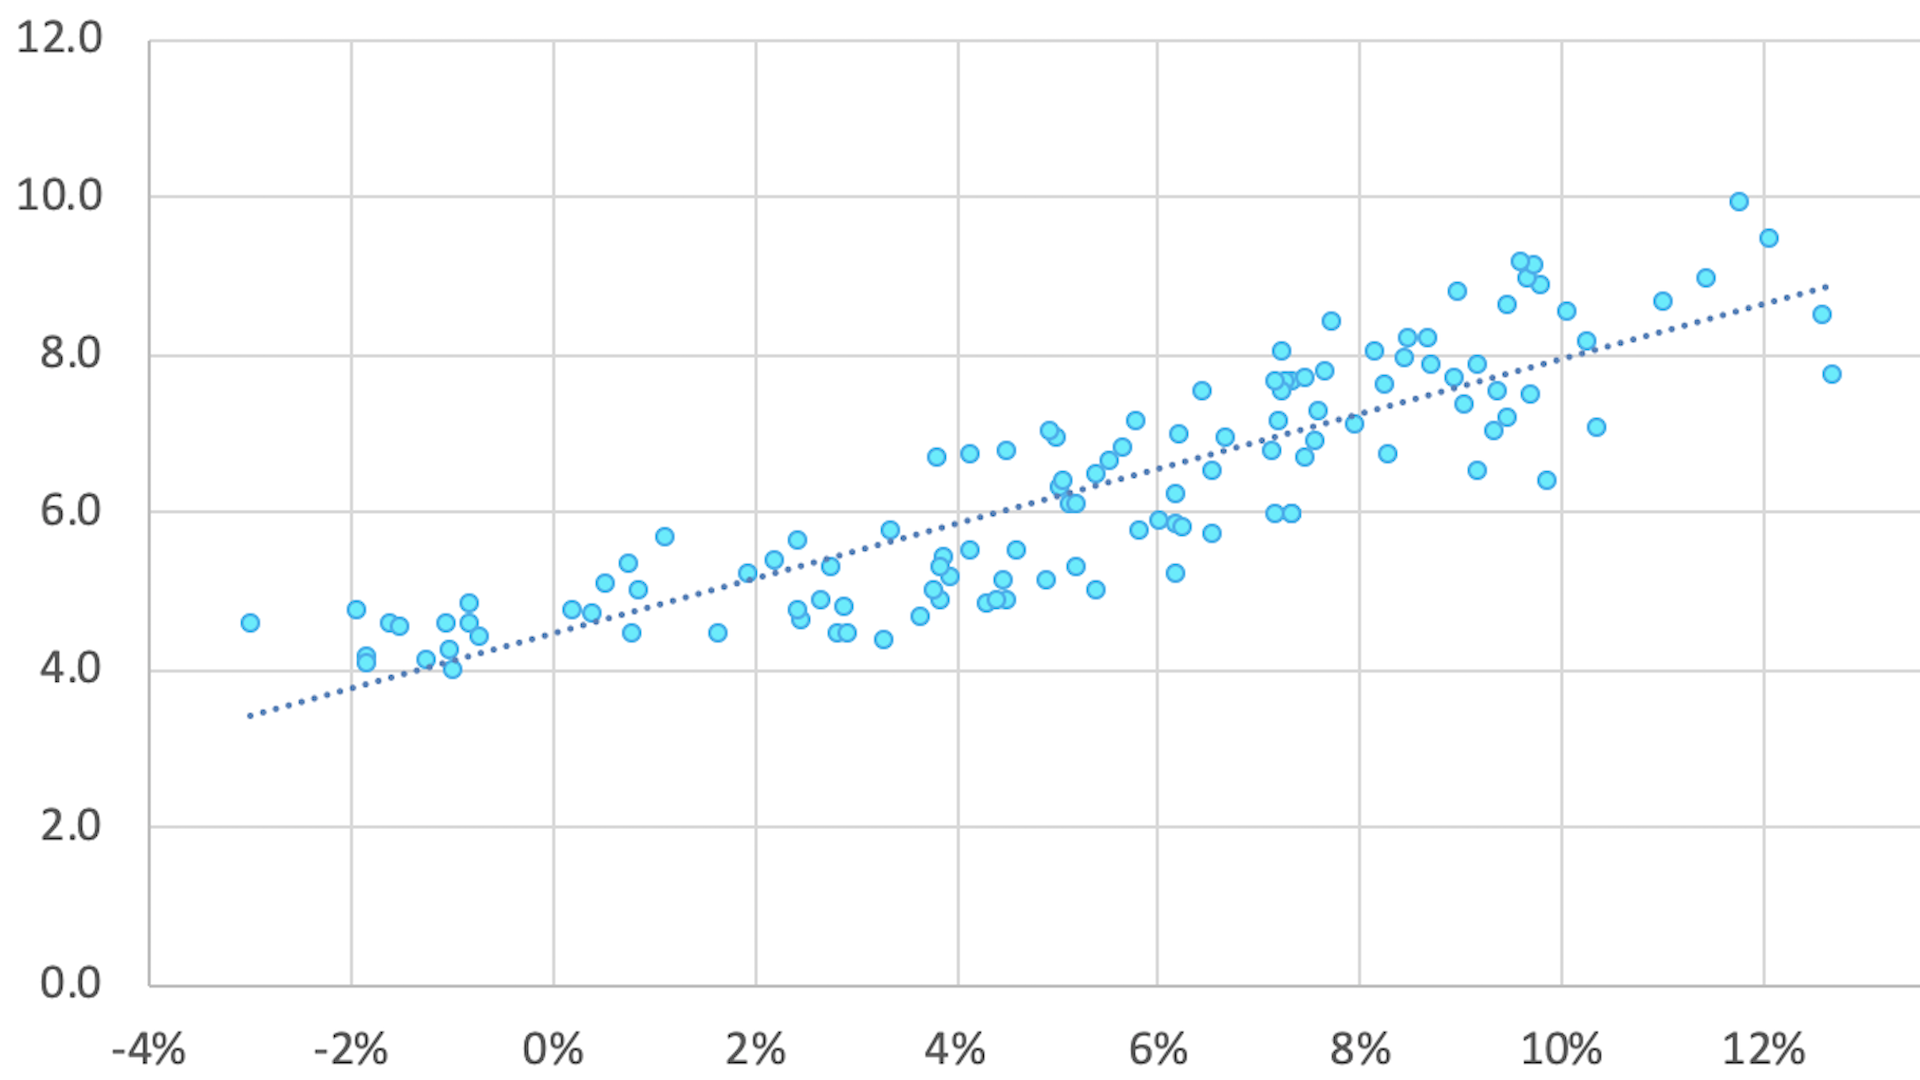
Figure 4: First 5 Years Returns and Withdrawal Rates

Source: DESMO Wealth Advisor, LLC calculations. Historical data from Rober Shiller from 1871 to 1925, and Ibbotson data from Dimensional Fund Advisors since 1926.
The figure shows that the lowest observed maximum sustainable rate increases as returns increase, For example, at 5% annual returns, the lowest maximum sustainable rate is 4.5%, and progressively increases to above 6% at about 8% annual returns.
Lessons
Obviously, we can’t know any of the future returns beforehand. However, we can learn a few useful lessons from the evidence we reviewed. As we know from Part 1, the key to a successful strategy is a dynamic approach that allows us to adjust spending over time to take advantage of spending opportunities under a safe withdrawal rate like the 4% rule. A simple way to use this information is to start with withdrawals of 4% of initial portfolio value, then increase consumption to about 4.5% or 5% down the road if it looks like 5-year returns are above 5% per year. We’ll review this and other approaches in Part 3 of our series, so make sure you tune in in the next few weeks.
Another key lesson of this empirical evidence is the advantage of working with a trusted advisor. The advisor can help you make sure your spending strategy makes the best use of your resources. Besides helping you identify the appropriate withdrawal amount, the key role of the advisor is to help you revise it every year as performance and your needs, goals, and priorities change. Given the economic importance of making appropriate adjustments, having expert advice to rely on is well worth the cost.
Until Next Time!
Massi De Santis is an Austin, TX fee-only financial planner and founder of DESMO Wealth Advisors, LLC. DESMO Wealth Advisors, LLC provides objective financial planning and investment management to help clients organize, grow, and protect their resources throughout their lives. As a fee-only, fiduciary, and independent financial advisor, Massi De Santis is never paid a commission of any kind, and has a legal obligation to provide unbiased and trustworthy financial advice.
