


Safe Retirement Spending And The 4% Rule
This post is part one of a three-part series on spending in retirement: How Much Can I Spend In Retirement?
You may have heard that withdrawing 4% of your initial portfolio value adjusted for inflation each year is a safe strategy to make sure your savings last through retirement. But where does the 4% come from? And is this still a good rule?
How much you can withdraw from your savings over time depends on the amount you have saved, your planning horizon, and the returns you are going to experience over time. The more you have saved, the shorter the time horizon, and the greater the returns over time, the greater the amount you can withdraw. What makes things complicated in retirement is that we don’t know future returns or the length of the planning horizon.
One way to address longevity is to assume a conservative planning horizon. For example, the average 65-year-old retiree has a life expectancy of about 21 years, but the typical planning horizon for retirement is 25-30 years. One way to overcome the uncertainty about returns is to look at historical data, which contains good years, bad years, and everything in between. A common way is to try and estimate how much income a hypothetical portfolio could generate historically over various 30 year periods.
Maximum withdrawal from a portfolio over time
Generating income for long periods of time is enhanced by exposure to risky growth investments like stocks, which is why most studies of retirement income focus on 50/50 or even 60/40 allocations to stocks and bonds. That may or may not be the best you can do, but we won’t address asset allocation issues at this stage and stick with a standard 60/40 portfolio. Using Robert Shiller’s data, we can estimate annual returns on a 60/40 starting in 1871. Then we can ask the question: If you retired in 1871 with $1 million in today’s dollars, what is the maximum amount that the portfolio could have generated over the next 30 years, knowing the actual returns of the portfolio? An actual retiree in 1871 would not have known the returns. However, by estimating the maximum withdrawal amount for all 30-year periods between 1871 and 2019, we can get a range of possible outcomes using historical data, and use this evidence as a starting point to develop a withdrawal strategy.
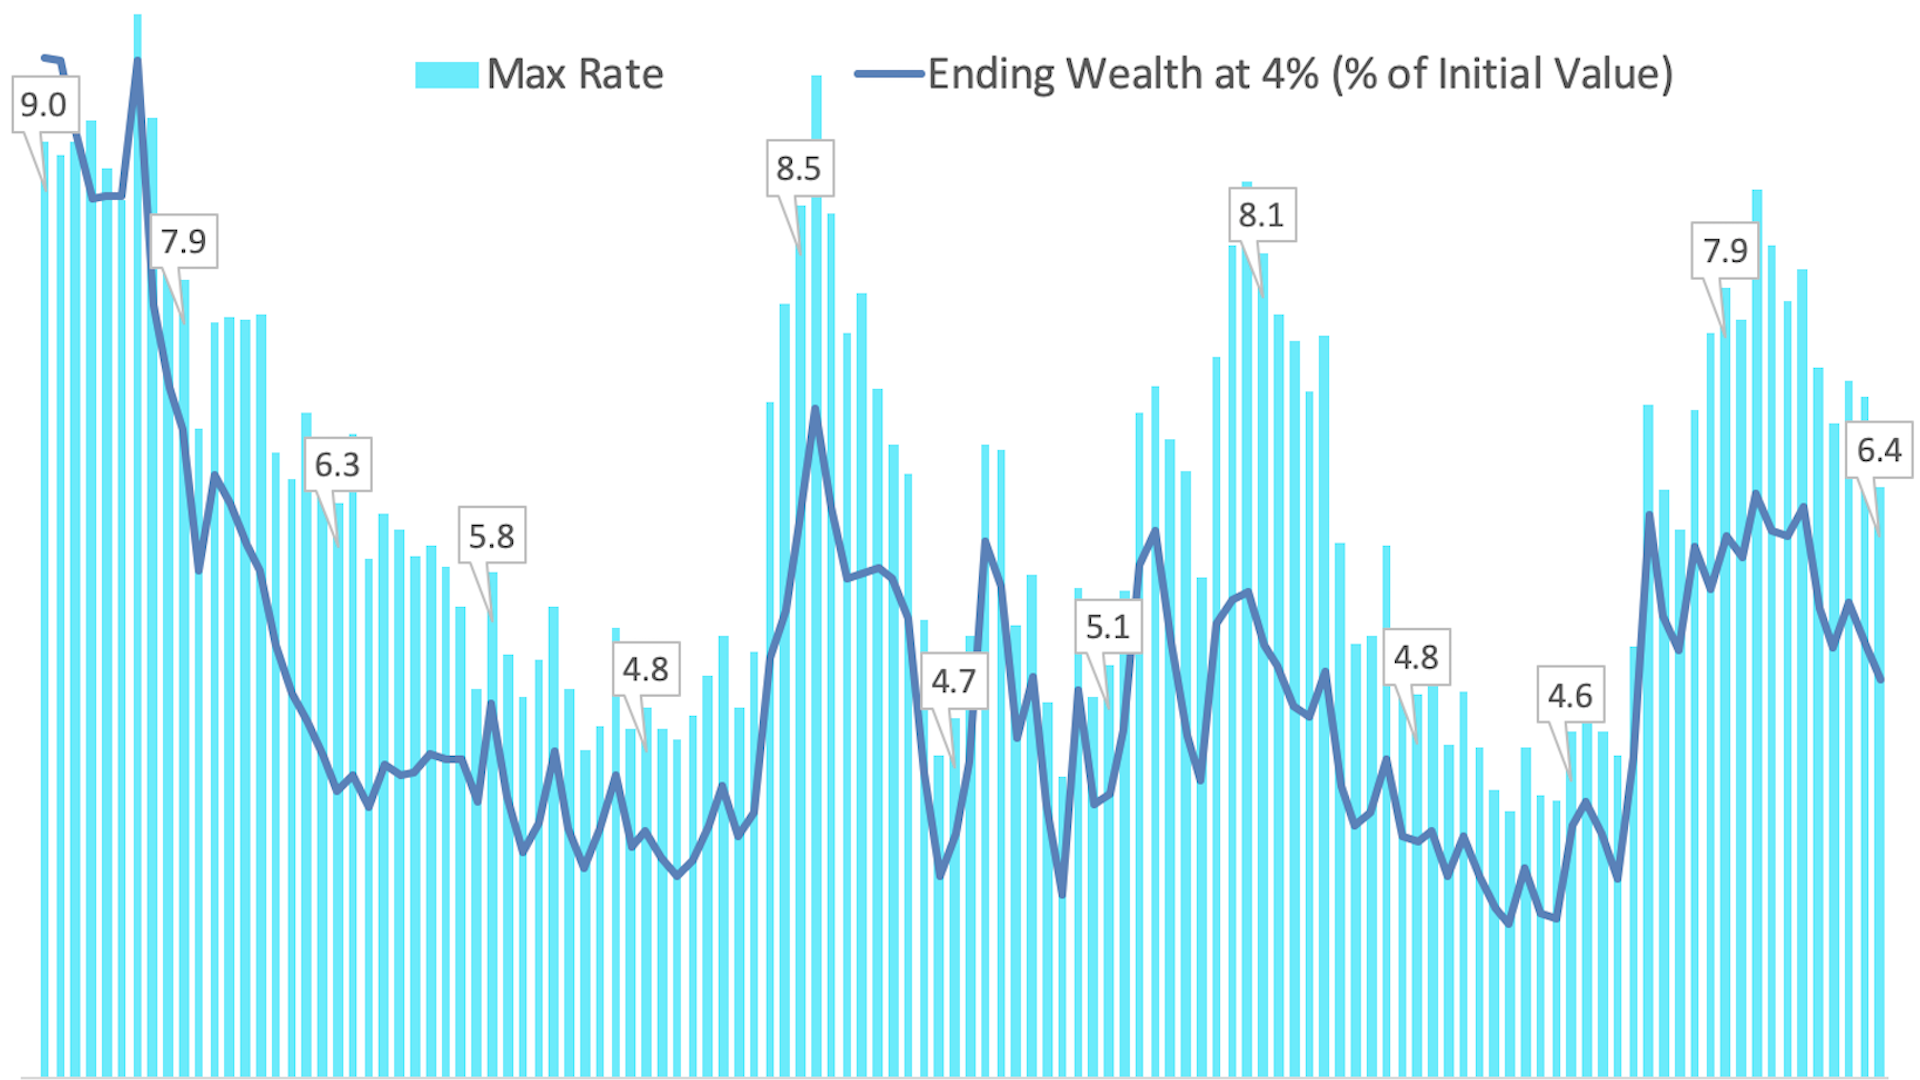
The blue bars in the figure below do just that. Each bar shows the estimated withdrawal amount as a percentage of initial value of the portfolio. For example, for the 30-year period starting in January 1871 and ending in December 1900, the maximum rate is 9%. This means that if a retiree had one million dollars at the start, he or she would be able to spend $90K a year over the next 30 years. Our estimation is in constant dollars, so it is assumed that every year the $90K would be adjusted for inflation. If in year 1 inflation is 2%, then the amount would be adjusted to $91.8K in year 2 and so on over the 30-year period. The assumption behind the calculation is that at the end of the period, the portfolio is completely exhausted.
Figure 1: Maximum Sustainable Withdrawal Over 30 Year Periods

Source: Maximum withdrawal rate from DESMO Wealth Advisors, LLC calculations using a line-search algorithm. Historical data from Rober Shiller from 1871 to 1925, and Ibbotson data from Dimensional Fund Advisors since 1926.
As you can see from the figure, the 9% is quite unusual, and lower numbers are more common. The distribution of the maximum withdrawal amount goes from a low of 4% of initial portfolio value for the 1966-start period to a high of 9.9% of initial portfolio value for the 1877 period. The latest period in the sample starts in 1990 and during that period the rate is 6.4%, which is close to the median value observed historically (the median is 6.2% of initial value). So, someone retiring in 1990 with a million dollars could have sustained a spending level of $64,000 a year adjusted for inflation every year.
The 4% Rule
In reality, we don’t know the returns over the next 30 years. However, given Figure 1, we can ask: “what is a withdrawal amount that we can expect to be reasonably safe over time?” Given that the minimum sustainable rate has been 4% historically, 4% of initial value adjusted for inflation could be a reasonably safe amount. There is no guarantee that this amount will work for sure in the future, but since we have experienced a broad range of returns in the past, it is a good starting point. The analysis above then provides a rationale for the 4% rule. It is the minimum, maximum withdrawal rate that would have worked historically. Not a bad start since we have experienced some major recessions in the period, banking panics, the Great Depression, the Great Inflation, and periods of low or negative real interest rates before (e.g. the 1970s).
Issues with the rule
As the figure shows, the range of withdrawal rates is wide. In 90% of the cases, a rate greater than 4.5% of initial value could have been sustained; in 62% of the cases, a rate greater than 5.5%; and in over 25% of the cases, a rate greater than 7.5%. While it’s always possible that even the 4% rate may be too much going forward, the historical evidence shows that the greater risk is that 4% can be too conservative as a rule, and can result in accumulating an unnecessary surplus at the end of the planning horizon.
The dark-blue line Figure 1 shows the wealth at the end of each of the 30-year periods considered, as a percentage of portfolio value at the beginning of the period, in constant dollars, assuming the 4% rule was used in each period. The scale for ending wealth is on the right y-axis in the figure.
In periods where the maximum sustainable rate is 4%, accumulated wealth is zero, by construction. However, in 50% of the cases, ending wealth is 125% of initial value or greater and in 25% of the cases, ending wealth is 228% of initial value or greater. That means that if you start with $1 million, there is a 25% chance that by spending annually 4% of initial value, or $40K adjusted for inflation every year, you could end up with $2.28 million or more in today’s dollars. For the 30-year period started in 1990 and ended in December 2019 (when we know a rate of 6.4% was sustainable) a retiree that started with $1MM would have ended the period with $1.6MM, in 1990 dollars!
All this means that, besides being very wide, the distribution of outcomes over the 30-year horizon is skewed towards potentially high outcomes. While starting with a low value like 4% is a safe strategy, following the rule blindly can lead to missed opportunities and unnecessary surpluses at the end of the horizon. The key issue in planning for retirement is how to best balance a safe withdrawal rate with the ability to capture spending opportunities using appropriate spending and asset allocation strategies. Do you have a good strategy? Tune in next week to find out!
Until Next Time!
Massi De Santis is an Austin, TX fee-only financial planner and founder of DESMO Wealth Advisors, LLC. DESMO Wealth Advisors, LLC provides objective financial planning and investment management to help clients organize, grow, and protect their resources throughout their lives. As a fee-only, fiduciary, and independent financial advisor, Massi De Santis is never paid a commission of any kind, and has a legal obligation to provide unbiased and trustworthy financial advice.
