Quantifying The Risk-Return Tradeoffs of Investing
This article is the second in a series of articles helping you build an investment policy statement (“IPS”), which is a blueprint for making investment decisions.
In most cases, we can rely on prices to evaluate the cost of our decisions. If what we get is greater than what we are willing to pay for it, buying makes sense. Prices make it easy to evaluate tradeoffs. When it’s about investing, however, the costs of our decisions are less apparent. For example, the S&P 500 has returned an average of over 10% per year since 1970. Surely there must be a cost to be paid to get that. What is the high return for? The standard response is that you have to go through the ups and downs of the stock market to earn the potentially high returns. But what does that mean?
Not having a good grasp of the risk of stocks is one of the key reasons why investment plans go bad. Thinking that all you have to do is sit back and wait may lead investors to overstate their tolerance or capacity for risk. It may also lead others to think that by doing a bit more, you can get the ups without the downs. The misunderstanding can lead to opposite reactions too, like staying out of risky investments for fear of losses when it may make sense to take the risk. How can we better understand the risk of stocks and other investments, and how can we use this information to help us select an appropriate level of risk for our goals and needs?
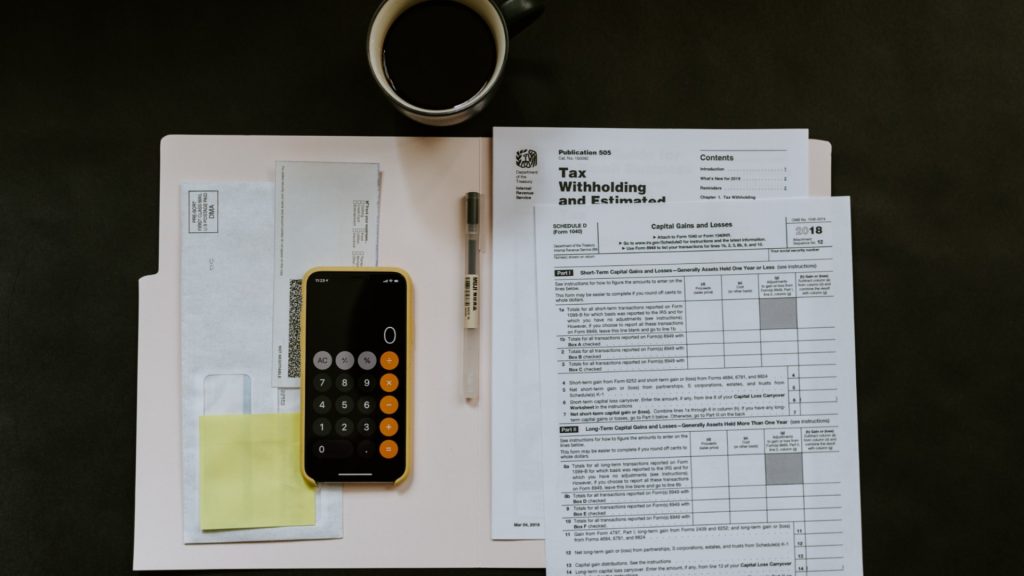
Short Term Losses Are Part of the Ride (S&P 500, Quarterly Data)

The 10% annualized return of stocks means that a dollar invested in 1970 grew to $182 fifty years later, as the chart above illustrates. However, the ride was far from smooth and short term losses have been a regular occurrence. The blue areas show the periods when the index was below its previous high, and by how much.
The previous high is relevant here because of our tendency to anchor our expectations to it, and because of our sensitivity to losses, a behavior known as loss aversion. Knowing that your portfolio went up from 900K to $950K this quarter is great if your previous peak was 900K, but not so great if the two quarters before the value was $1 million.
The chart shows that in over half of the quarters of the period (51%), the S&P 500 traded below its previous high. The percentage by which the index is below its previous high is over 10%, on average, but it can be higher (over 40%), and for long periods. The blue area shows that one of the costs of investing in stocks is many quarters of potential disappointment.
Loss Aversion and Risk
Returns can vary so much year-over-year that while the average is 10%, annual returns are almost surely different from that. Over a 12-month period, S&P 500 returns can be as high as 61% and as low as negative 43% (using monthly data). Getting a 61% boost to your nest egg can sure feel good, but how would you feel about watching a $1,000,000 portfolio drop to $570,000 in a 12-month period? Could you go through that without losing sleep? Besides long periods below previous highs, large potential losses are another cost of investing in stocks for the potential of higher returns.
The figure below compares the returns on some stock market indices with the returns on one-month T-Bills.
The Tradeoff of Risk vs. Returns (1970-2020)

Sources and Notes: DESMO Wealth Advisors, LLC analysis of data from Dimensional Fund Advisors. Large Stocks represented by S&P 500 index, Small Stocks by CRSP 6-10 deciles index, international by MSCI World ex-USA (net div) index, Treasury Bills by one-month T-bills. The information is provided for illustration purposes and does not constitute investment advice. It is not possible to invest in an index, and these returns do not consider the effects of taxes and management fees.
While stock markets have tended to reward investors with relatively high returns, the bottom part of the figure shows that one year losses can be substantial. In contrast, safe government bonds like Treasury bills have experienced no negative one-year returns during the period since 1970. The returns, however, are much lower than for stocks. That is the relationship between risk and return. Notice at the other end of the spectrum how small-cap stocks have had higher returns than large stocks, but also higher one-year losses.
Balanced Portfolios
In a typical portfolio, we can achieve intermediate levels of risk and return by blending different stocks and bonds as shown in the table below.
Risk And Returns of Different Stock/Bonds Allocations (1970-2020)
| Statistics | Conservative 40/60 | Balanced 50/50 | Moderate 60/40 |
| Annualized Return | 7.2% | 7.8% | 8.3% |
| Lowest Highest Return | |||
| Highest 1-Year Return | 25.7% | 30.8% | 35.4% |
| Lowest 1-Year Return | -20.5% | -25.3% | -29.9% |
| Highest 3-Year Annualized Return | 19.5% | 22.6% | 26.0% |
| Lowest 3-Year Annualized Return | -4.6% | -6.5% | -8.5% |
Focusing on the 50/50 portfolio, you can see that the range of one-year return is between negative 25% and 61%, or about half of the range of the S&P 500 alone (-43% to +61%). As we increase the percentage allocated to stocks, the range widens. But over time, even just over three years, the range narrows substantially.
Link the range of outcomes to your goals and preferences
The range of outcomes can help us quantify potential losses and the relationship between risk and returns. However, these values become meaningful only if we can relate them to our goals and our preferences for risk.
Consider preferences first. If you are affected by short term movements, check your account balance often, tend to brood over past decisions, and are likely to change your investments after substantial losses, you may overreact to short term losses. Be aware of the potential losses of your investments and decide whether that may be too much for you. A risk tolerance questionnaire can help you determine your preferences for risk. Ask us about our free risk assessment.
Next, consider your goals and your financial capacity for risk. For example, suppose you plan a large purchase in the medium term. It could be a college goal or a large home renovation. How much can you afford to lose and still make up for it with additional savings over your investment horizon? Could you make up for a 20% loss over the remaining time with additional savings? Or would you have the flexibility to postpone your goal? The answers to these questions depend on your goals, priorities, and ability to save, which together form a concept we call risk capacity.
***
Understanding the relation between risk and return helps you clarify the cost-benefit tradeoff that you are making to reach your goals, and it helps you create a structure for making investment decisions and managing your portfolio, your investment blueprint. You can start building your own blueprint first outlining your goals and priorities and evaluating your risk capacity. Then use the tables above to start building an asset allocation for your goals.